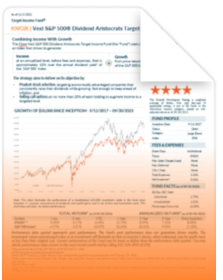
Vest S&P 500® Dividend Aristocrats Target Income Fund

Income
Growth
There is no guarantee that the investment objective will be achieved.
- Prudent stock selection that includes targeting economically advantaged companies that consistently raise their dividends while growing fast enough to keep ahead of inflation, and
- Use of options that includes implementing a partial call option selling strategy to augment the income to a targeted level.
Why Invest in This Fund

- High dividend stocks (such as the Dow Jones U.S. Select Dividend Index) pay higher-than-average dividends, but they have historically delivered lower total returns with higher volatility.
- Dividend grower stocks (such as the S&P 500 Dividend Aristocrats Index) focus on consistently increasing their dividends over time and deliver higher-than-average total returns and lower volatility, but with lower dividend yields.

How It Works

- The dividends from the stock portfolio
- Premiums collected by selling calls on a portion of the stocks

Where It Fits in the Portfolio
- Strategic income allocation, for the income that seeks to outpace inflation
- Strategic core (low risk) large-cap equity allocation, for the total returns
- Inflation hedge allocation

Additional Resources & FAQs

Regulatory Documents

-
What is a call option?
A call option on a stock gives the buyer the right to buy 100 shares of stock at a fixed price up to a specific future date in exchange for an upfront payment. The fixed price is referred to as the strike price, the future date is referred to as expiry date and the upfront payment is referred to as the premium. Effectively, the buyer pays the premium up front and acquires the right to a stock’s future price appreciation above the strike price. The seller, on the other hand, gives up the right to the stock’s future price appreciation above the strike price in exchange for upfront premium payment as income. Call options allow investors to trade in the future upside of a stock relative to a pre-fixed strike price in return for an upfront premium. -
What is a covered call strategy?
A covered call strategy is a strategy in which an investor owns (or “holds a long position in”) a stock and sells (or “writes”) call options on that same stock. By selling the call options, the seller gives up the right to the stock’s future price appreciation over the strike price and receives an upfront premium payment as compensation. The covered call strategy gives the seller the unique ability to convert a stock’s uncertain future returns into certain upfront premium income. Investors who sell covered calls typically execute continuously rolling covered call strategies (i.e., when the sold call option expires, they sell a new call option). For example, the investor may sell a call option on a stock with one month to expiry against a long position on the stock. The investor collects the premium income and gives up future upside. One month later, when the call option expires, the investor will sell a new call option with one month to expiry and collect premium income again. This process repeats on a rolling basis. A covered call strategy is also known as a “buy-write strategy” or may be referred to as a “call option selling strategy.” -
What is a partial call option selling strategy?
First, let’s define a fully covered call selling strategy as one in which the investor sells calls against the entire long position on the stock. (Put another way, he/she sells calls on every share of stock he/she owns). This means the investor gives up future price appreciation of the stock above the call strike price in return for the upfront premium. In contrast, the partial call selling strategy is one in which an investor sells calls on a smaller percentage of each stock holding. A partial call selling strategy would collect a lower level of premium income but would also give up only a portion of the future returns. A partial call selling strategy allows an investor to strike the appropriate balance between the upfront predictable premium income collected and the future returns given away. As an illustration, let’s say an investor holds 1,000 shares of XYZ stock. A 10% call selling strategy (or 10% “overwrite”) means that the investor sells calls on only 100 of the 1,000 shares. He/she collects premiums in return for selling calls on 100 shares, and gives up the future upside on those 100 shares if, in the future, the price rises above the strike price. He/she retains the future potential appreciation on 900 shares. -
How does the fund choose which stocks to cover and where to sell the calls?
The Index strategy sells some calls on every stock holding in the Aristocrats portfolio The calls are sold “at the money,” meaning at or close to the price of the stock at the time of the sale. As an illustration, let’s say there are 50 stocks in the portfolio, and the Index methodology states that calls should be sold on 10% of the shares of each stock holding. By doing this repeatedly each month, the strategy seeks to generate an annualized premium income of 10% over the annual dividend yield of the S&P 500, while still allowing investors to participate in at least 90% of the potential future growth from price appreciation. Note: By design, the Index methodology limits the sales of calls to the requisite amount needed to augment income to the targeted level. Investors' participation in potential future stock price increases may be limited by the potential for some of the call options sold to be exercised. -
Where could investors consider using this strategy in their portfolios?
The Fund can fit in three places in an investor's portfolio:- Strategic income allocation, for the income that seeks to outpace inflation
- Strategic core (low risk) large-cap equity allocation, for the total returns
- Inflation hedge allocation
-
When was The Vest Dividend Aristocrats Target Income Fund launched?
The Fund was launched in September 2017. -
When does the Fund pay out distributions and what is the makeup of these distributions?
Distributions are paid quarterly and consist of the available dividend payments for the quarter from all the stocks in the portfolio, plus premiums from selling options. -
What are the tax implications of the strategy?
The fund holds dividend-producing equity securities. These securities pay dividend income to the fund, which is then distributed (net of expenses) to shareholders. The dividend income can be considered ordinary or qualified dividends. The premiums realized from selling call options are considered short-term capital gains. The above material is not intended to be tax advice. The above tax consequences of dividend distributions may vary by individual tax payer. Please consult your tax professional or financial advisor for more information regarding your specific situation. -
What is the breakdown of income from options vs dividends?
The breakdown of income from dividends and options may vary each month. The stocks in the portfolio may deliver dividend income. Residual income may come from selling just the right amount of call options each month on a smaller fraction of each stock holding in the portfolio, aiming to generate an annualized level of income of 10% over the dividend yield of the S&P 500. As an illustration, if the portfolio of stocks delivered a 2.5% annualized dividend yield and there was an additional 9.0% in annualized option premium income with a net expense of 0.95%, then the total net distribution would be 10.55%. (2.5% from dividends plus 9.0% from options premium less 0.95% in expenses). Note: For illustrative purposes only and does not represent actual results. Covered call strategies do not ensure profits or guarantee against losses. It is not possible to invest in an index. -
What is the net distribution after fees and expenses?
The strategy seeks to deliver a net distribution after fees that is the dividend yield on the equity securities, plus the premium income received from selling calls, minus the fund’s expense ratio. Vest Financial LLC (the “Adviser”) has entered into a written expense limitation agreement under which it has agreed to limit the total expenses of the Fund (exclusive of interest, distribution fees pursuant to Rule 12b-1 Plans, taxes, acquired fund fees and expenses, brokerage commissions, extraordinary expenses and dividend expense on short sales) to an annual rate of 0.95% of the daily net assets of each class of shares of the Fund offered in this prospectus, except for the Class Y shares where the Adviser has agreed to limit the total expenses to 0.70%, and 0.49%, respectively The Adviser may not terminate this expense limitation agreement prior to February 28, 2027. -
Will a partial call selling strategy underperform if the stock appreciates over a week?
Not necessarily. Remember that the investor collects a premium on the calls sold. The covered call portion of the partial call selling strategy will underperform a stock-only position if the stock increases to the level that the loss on the call option at expiration exceeds the premium collected. Therefore, a covered call strategy could outperform a stock-only position even if the stock appreciates over the term of the strategy (typically a week). As an illustration, let’s say a call is sold at $105 at a premium of $3. If the stock rises to $110 upon expiry, then the covered call will underperform the stock-only position by $2 ($105 strike - $110 at expiry +$3 option premium). Now, if the stock instead rose only to $106 upon expiry, the covered call will outperform the stock-only position by $2 ($105 strike - $106 at expiry + $3 option premium). -
How does the methodology characterize and assess the risk/reward trade-offs of using the weekly call-selling employed in The Vest S&P 500 Dividend Aristocrats Target Income Fund, versus the quarterly options that are more typically used in more common call-selling strategies?
It is possible to generate more premium income by selling weekly call options instead of quarterly call options. The potential disadvantage of selling weekly call options versus quarterly options is higher transaction costs.
Performance (KNGIX — Institutional Share Class)
- Dividend Income from its stock positions
- Short-Term Capital Gains, such as options premiums, collected from selling calls

Quarter End Performance (as of 06/30/2026)
| Total Returns | Annualized Returns | |||||
|---|---|---|---|---|---|---|
| Symbol | Q1 2026 | YTD | 1 Year | 3 Year | 5 Year | Since Inception (9/11/2017) |
| KNGIX* | 6.44% | 7.91% | 12.36% | 6.97% | 5.49% | 8.80% |
| S&P 500 Index | 15.20% | 10.21% | 22.33% | 20.61% | 13.41% | 15.22% |
Performance data quoted represents past performance. The Funds’ past performance does not guarantee future results. The investment return and principal value of an investment will fluctuate so that an investor’s shares, when redeemed, may be worth more or less than their original cost. Current performance of the Funds may be lower or higher than the performance data quoted. You may obtain performance data current to the most recent month end by calling 855-505-VEST (8378).
*Since share classes have different sales charges, fees, and other features, the performance of other share classes may differ from the performance listed for Institutional class shares.
Distributions^
| Date | Dividend | Short-Term Cap Gains | Long-Term Cap Gains | Total Distributions | NAV | Periodic Distribution Rate |
|---|---|---|---|---|---|---|
| 07/01/2026 | $0.0521 | $0.2551 | $0.0000 | $0.3072 | $11.62 | 2.64% |
| 04/01/2026 | $0.0753 | $0.7178 | $0.0000 | $0.7931 | $11.71 | 6.77% |
| Date | Dividend | Short-Term Cap Gains | Long-Term Cap Gains | Total Distributions | NAV | Periodic Distribution Rate |
|---|---|---|---|---|---|---|
| 12/30/2025 | $0.0337 | $0.0000 | $0.0000 | $0.0337 | $11.68 | 0.29% |
| 10/01/2025 | $0.044 | $0.2583 | $0.0000 | $0.3023 | $11.71 | 2.58% |
| 07/01/2025 | $0.0484 | $0.2563 | $0.0000 | $0.3047 | $11.72 | 2.60% |
| 04/01/2025 | $0.0861 | $0.2327 | $0.0000 | $0.3188 | $11.80 | 2.70% |
| Date | Dividend | Short-Term Cap Gains | Long-Term Cap Gains | Total Distributions | NAV | Periodic Distribution Rate |
|---|---|---|---|---|---|---|
| 12/31/2024 | $0.0304 | $0.0000 | $0.3742 | $0.4046 | $11.81 | 3.43% |
| 10/1/2024 | $0.0425 | $0.3097 | $0.0000 | $0.3522 | $12.98 | 2.71% |
| 7/1/2024 | $0.0449 | $0.2814 | $0.0000 | $0.3263 | $11.96 | 2.73% |
| 4/1/2024 | $0.0158 | $0.0994 | $0.0000 | $0.1152 | $12.91 | 0.89% |
| 3/1/2024 | $0.0264 | $0.0851 | $0.0000 | $0.1115 | $12.60 | 0.88% |
| 2/1/2024 | $0.0126 | $0.0976 | $0.0000 | $0.1102 | $12.51 | 0.88% |
| Date | Dividend | Short-Term Cap Gains | Long-Term Cap Gains | Total Distributions | NAV | Periodic Distribution Rate |
|---|---|---|---|---|---|---|
| 12/29/2023 | $0.0383 | $0.0000 | $0.0000 | $0.0383 | $12.56 | 0.30% |
| 12/20/2023 | $0.0000 | $0.0000 | $0.3175 | $0.3175 | $12.34 | 2.57% |
| 11/01/2023 | $0.0058 | $0.1000 | $0.0000 | $0.1058 | $11.69 | 0.91% |
| 10/02/2023 | $0.0187 | $0.0803 | $0.0000 | $0.0990 | $12.07 | 0.82% |
| 9/01/2023 | $0.0240 | $0.0919 | $0.0000 | $0.1159 | $13.01 | 0.89% |
| 8/01/2023 | $0.0038 | $0.0658 | $0.0000 | $0.0696 | $13.38 | 0.52% |
| 7/03/2023 | $0.0208 | $0.0251 | $0.0000 | $0.0459 | $13.16 | 0.35% |
| 6/01/2023 | $0.0230 | $0.0213 | $0.0000 | $0.0443 | $12.34 | 0.36% |
| 5/01/2023 | $0.0067 | $0.0396 | $0.0000 | $0.0463 | $13.05 | 0.35% |
| 4/03/2023 | $0.0201 | $0.0261 | $0.0000 | $0.0462 | $12.86 | 0.36% |
| 3/01/2023 | $0.0217 | $0.0252 | $0.0000 | $0.0469 | $12.70 | 0.37% |
| 2/01/2023 | $0.0051 | $0.0420 | $0.0000 | $0.0471 | $13.22 | 0.36% |
| Date | Dividend | Short-Term Cap Gains | Long-Term Cap Gains | Total Distributions | NAV | Periodic Distribution Rate |
|---|---|---|---|---|---|---|
| 12/30/2022 | $0.0006 | $0.0000 | $0.0689 | $0.0695 | $12.76 | 0.54% |
| 12/01/2022 | $0.0244 | $0.0236 | $0.0000 | $0.0480 | $13.40 | 0.36% |
| 11/1/2022 | $0.0062 | $0.0399 | $0.0000 | $0.0461 | $12.53 | 0.37% |
| 10/3/2022 | $0.0220 | $0.0213 | $0.0000 | $0.0433 | $11.76 | 0.37% |
| 9/01/2022 | $0.0176 | $0.0399 | $0.0000 | $0.0575 | $12.66 | 0.45% |
| 8/01/2022 | $0.0041 | $0.0521 | $0.0000 | $0.0562 | $13.06 | 0.43% |
| 7/01/2022 | $0.0240 | $0.0278 | $0.0000 | $0.0518 | $12.48 | 0.42% |
| 06/01/2022 | $0.0195 | $0.0344 | $0.0000 | $0.0539 | $13.10 | 0.41% |
| 05/02/2022 | $0.0038 | $0.0422 | $0.0000 | $0.0460 | $13.22 | 0.35% |
| 04/01/2022 | $0.0203 | $0.0260 | $0.0000 | $0.0463 | $13.91 | 0.33% |
| 03/01/2022 | $0.0189 | $0.0269 | $0.0000 | $0.0458 | $13.18 | 0.35% |
| 02/01/2022 | $0.0105 | $0.0354 | $0.0000 | $0.0459 | $13.82 | 0.33% |
| Date | Dividend | Short-Term Cap Gains | Long-Term Cap Gains | Total Distributions | NAV | Periodic Distribution Rate |
|---|---|---|---|---|---|---|
| 12/30/2021 | $0.0000 | $0.0000 | $0.0887 | $0.0887 | $14.35 | 0.62% |
| 12/01/2021 | $0.0223 | $0.0227 | $0.0000 | $0.0450 | $13.44 | 0.33% |
| 11/01/2021 | $0.0091 | $0.0583 | $0.0000 | $0.0674 | $13.88 | 0.49% |
| 10/01/2021 | $0.0206 | $0.0481 | $0.0000 | $0.0687 | $13.22 | 0.52% |
| 09/01/2021 | $0.0170 | $0.0545 | $0.0000 | $0.0715 | $13.96 | 0.51% |
| 08/02/2021 | $0.0097 | $0.0537 | $0.0000 | $0.0634 | $13.77 | 0.46% |
| 07/01/2021 | $0.0230 | $0.0478 | $0.0000 | $0.0708 | $13.65 | 0.52% |
| 06/01/2021 | $0.0183 | $0.0527 | $0.0000 | $0.0710 | $13.85 | 0.51% |
| 05/03/2021 | $0.0087 | $0.0368 | $0.0000 | $0.0455 | $13.71 | 0.33% |
| 04/01/2021 | $0.0211 | $0.0241 | $0.0000 | $0.0452 | $13.13 | 0.34% |
| 03/01/2021 | $0.0190 | $0.0229 | $0.0000 | $0.0419 | $12.44 | 0.34% |
| 02/01/2021 | $0.0103 | $0.0309 | $0.0000 | $0.0412 | $12.00 | 0.34% |
| 01/04/2021 | $0.0191 | $0.0236 | $0.0000 | $0.0427 | $12.01 | 0.36% |
| Date | Dividend | Short-Term Cap Gains | Long-Term Cap Gains | Total Distributions | NAV | Periodic Distribution Rate |
|---|---|---|---|---|---|---|
| 12/01/2020 | $0.0238 | $0.0184 | $0.0000 | $0.0422 | $12.12 | 0.35% |
| 11/02/2020 | $0.0098 | $0.0299 | $0.0000 | $0.0397 | $11.15 | 0.36% |
| 10/01/2020 | $0.0221 | $0.0186 | $0.0000 | $0.0407 | $11.10 | 0.37% |
| 09/01/2020 | $0.0166 | $0.0235 | $0.0000 | $0.0401 | $11.36 | 0.35% |
| 08/03/2020 | $0.0136 | $0.0260 | $0.0000 | $0.0396 | $10.93 | 0.36% |
| 07/01/2020 | $0.0179 | $0.0210 | $0.0000 | $0.0389 | $10.40 | 0.37% |
| 06/01/2020 | $0.0175 | $0.0219 | $0.0000 | $0.0394 | $10.41 | 0.38% |
| 05/01/2020 | $0.0174 | $0.0214 | $0.0000 | $0.0388 | $9.62 | 0.40% |
| 04/01/2020 | $0.0193 | $0.0188 | $0.0000 | $0.0381 | $8.67 | 0.44% |
| 03/02/2020 | $0.0110 | $0.0297 | $0.0000 | $0.0407 | $10.93 | 0.37% |
| 02/03/2020 | $0.0113 | $0.0322 | $0.0000 | $0.0435 | $11.58 | 0.38% |
| 01/02/2020 | $0.0000 | $0.0173 | $0.0000 | $0.0173 | $11.89 | 0.15% |
| Date | Dividend | Short-Term Cap Gains | Long-Term Cap Gains | Total Distributions | NAV | Periodic Distribution Rate |
|---|---|---|---|---|---|---|
| 12/31/2019 | $0.0229 | $0.0000 | $0.0045 | $0.0274 | $11.90 | 0.23% |
| 12/16/2019 | $0.0000 | $0.0000 | $0.0441 | $0.0441 | $11.83 | 0.37% |
| 11/1/2019 | $0.0113 | $0.0322 | $0.0000 | $0.0435 | $11.53 | 0.38% |
| 10/01/2019 | $0.0149 | $0.0289 | $0.0000 | $0.0438 | $11.18 | 0.39% |
| 09/03/2019 | $0.0174 | $0.0262 | $0.0000 | $0.0436 | $10.97 | 0.40% |
| 08/01/2019 | $0.0110 | $0.0317 | $0.0000 | $0.0427 | $11.00 | 0.39% |
| 07/01/2019 | $0.0142 | $0.0282 | $0.0000 | $0.0424 | $11.16 | 0.38% |
| 06/03/2019 | $0.0139 | $0.0273 | $0.0000 | $0.0412 | $10.52 | 0.39% |
| 05/01/2019 | $0.0099 | $0.0319 | $0.0000 | $0.0418 | $10.91 | 0.38% |
| 04/01/2019 | $0.0148 | $0.0265 | $0.0000 | $0.0413 | $11.01 | 0.38% |
| 03/01/2019 | $0.0140 | $0.0275 | $0.0000 | $0.0415 | $10.79 | 0.38% |
| 02/01/2019 | $0.0245 | $0.0146 | $0.0000 | $0.0391 | $10.37 | 0.38% |
| Date | Dividend | Short-Term Cap Gains | Long-Term Cap Gains | Total Distributions | NAV | Periodic Distribution Rate |
|---|---|---|---|---|---|---|
| 12/28/2018 | $0.0169 | $0.0279 | $0.0000 | $0.0448 | $9.80 | 0.46% |
| 12/03/2018 | $0.0152 | $0.0253 | $0.0000 | $0.0405 | $10.85 | 0.37% |
| 11/01/2018 | $0.0097 | $0.0310 | $0.0000 | $0.0407 | $10.44 | 0.39% |
| 10/01/2018 | $0.0153 | $0.0266 | $0.0000 | $0.0419 | $11.00 | 0.38% |
| 09/04/2018 | $0.0205 | $0.0633 | $0.0000 | $0.0838 | $10.90 | 0.77% |
| 07/02/2018 | $0.0308 | $0.0661 | $0.0000 | $0.0969 | $10.31 | 0.94% |
| 04/02/2018 | $0.0464 | $0.0740 | $0.0000 | $0.1204 | $10.14 | 1.19% |
| 01/02/2018 | $0.0000 | $0.0096 | $0.0000 | $0.0096 | $10.81 | 0.09% |
** The 30-Day SEC Yield calculations only accounts for the dividend income and does not accurately portray the full distribution made by the fund.
^ On the market close of July 21, 2023 the Fund's income target changed from 3.5% over the annual dividend yield of the S&P500® Index to 10% over the annual dividend yield of the S&P500® Index. Therefore, distribution information prior to July 24, 2023 represents the Fund's prior income target.
30-Day SEC Yield: The SEC yield is a standard yield calculation developed by the U.S. Securities and Exchange Commission (SEC) that allows for fairer comparisons of bond funds. It is based on the most recent 30-day period covered by the fund's filings with the SEC. The 30-day SEC Yield reflects the dividends and interest earned during the period after the deduction of the fund's expenses. The Subsidized yield includes contractual expense reductions and it would be lower without those reductions. The Unsubsidized yield excludes contractual expense reductions.
Annualized Yield: Calculated by taking the sum of all the Periodic Distribution Rates over the past 12 months. Annualized Yield numbers are based on historical distributions and NAVs and are not predictive of future distributions or yields. Annualized Yield is calculated to provide a sense of the total cash flow associated with investment in the fund, but should not be confused with SEC yield, dividend yield or interest yield.
Periodic Distribution Rate: Calculated by taking the total distribution and dividing it by the NAV on that date.
Fund Facts & Stats
Fund Snapshot
Expenses
*Vest Financial LLC (the “Adviser”) has contractually agreed to limit the Fund’s total annual operating expenses to 0.95% of daily net assets (0.70% for Class Y shares) until at least February 28, 2027.
Important Disclosures, Please Read
Investors should consider the investment objectives, potential risks, management fees and charges and expenses carefully before investing. This and other information is contained in the Fund’s prospectus, which may be obtained online, or by calling 855-505-VEST (8378). Please read the prospectus carefully before investing. Distributed by Foreside Fund Services, LLC, Portland, ME. Member FINRA/SIPC.
View this firm’s background on FINRA’s BrokerCheck. On January 2, 2024, the Fund’s name changed from Cboe Vest S&P 500® Dividend Aristocrats Target Income Fund to Vest S&P 500® Dividend Aristocrats Target Income Fund. This is a change in name only; the Fund’s objective and principal investment strategy remain the same. Any comments or statements made herein do not reflect the views of Vest Group Inc. or any of their subsidiaries or affiliates.Definitions and Key Terms
Risk Factors
Vest Financial LLC is an investment advisory firm registered with the U.S. Securities and Exchange Commission (SEC). Registration does not imply a certain level of skill or training. Vest Financial LLC is a wholly owned subsidiary of Vest Group Inc. Vest offers institutional-quality Target Outcome Investments® built on the backbone of its unique investment philosophy—that strive to buffer losses, amplify gains or provide consistent income — to a diverse spectrum of investors.