
In our recent post, we reframed how buffers function in real-world portfolios. This follow-up focuses on benchmarking—and why traditional metrics fall short when evaluating engineered outcome strategies.
As buffer strategies gain momentum, so too does the scrutiny. A growing number of critics have turned to a seemingly elegant way to discredit them: comparing the funds to a blend of equities and cash. The method is simple: build a synthetic portfolio of (X × equities) + (1 -X) × T-bills and compare performance on carefully selected metrics of return and risk.
Some critics apply this at the individual fund level. Others run the analysis across entire fund categories. Either way, the result is usually the same: "look, these buffer funds underperformed a simple cash-weighted strategy."
It’s a neat trick. But it’s also fundamentally flawed.
The Benchmarking Trick You Can Use on Anything
Let’s call this what it is: a motivated comparison technique.
Take any strategy, find its realized statistics (e.g.: cumulative returns, drawdown, volatility, Sharpe-ratio) and then build a linear portfolio of stocks and cash and vary the cash weights till you find the weight such that the portfolio outperforms the strategy on some selected statistical measure over a carefully selected timeframe. With the right timeframe, the right re-balance frequency, the right set of statistical measures, and the right choice of X, you can almost always show that your synthetic blend outperforms the actual strategy on traditional linear measures like Sharpe ratio or drawdown, with the benefit of hindsight. This technique only works on a cherry-picked, backward-looking basis and offers no help to an investor that is looking to invest for the future.
To prove the point, let’s turn the lens around and apply this method to the world of Hedge Fund Strategies. Let’s use the Bloomberg All Hedge Index (BHEDGE) that represents the performance of hedge funds, as defined by the Bloomberg Hedge Fund classifications.
We calculated the realized beta of the BHEDGE index to the S&P 500 over a time frame from March 2025 to the date of earliest available data for the index (December 31, 2013). The result was about 0.34. We constructed a synthetic portfolio of 34% S&P 500 / 66% 3-month T-bills and compared it to BHEDGE.
Guess what? It beat the hedge fund index! But that says more about the method than the market
Figure 1: Risk Return Comparison: Hedge Fund Index against Beta Matched Portfolio

Source: Bloomberg from 12/31/2013 to 3/31/2025.
The synthetic portfolio outperformed on return and did better on volatility and drawdown. A critic might say: "See? It's better and safer!” Should we then conclude that the hedge fund industry offers no value? That it should be replaced with a static 2-asset mix?
Of course not. Hedge funds pursue nonlinear, active, asymmetric strategies. Their job isn’t to beat a beta blend. Their job is to deliver differentiated return paths, manage risk in alternative ways, and offer value in different market conditions.
It's a biased framing. It is unfair framing. And this motivated mathematical framing is being applied to the buffer strategies today. So let us take it apart one at a time.
The Hindsight Bias
Critics use ex-post beta, calculated after returns are known. It is as if they are blessed with a time machine—one that lets you go back, build a portfolio with the perfect beta and claim it was always better.
The flaw? Investors and managers don’t have that luxury. They can’t invest with hindsight. The beta at the start of the period—the only one that matters from a real-world implementation standpoint—is unknown and unknowable.
This criticism matters because it exposes the difference between a historical backtest and an investable product. One is an academic exercise; the other is a portfolio construction tool.
Beta Isn't Static—and Neither Are Buffer Strategies
Buffer strategies don’t operate with a stable beta. They are built using options, and their beta shifts meaningfully depending on market conditions and where the index stands relative to the buffer or cap.
Our analysis of rolling one-year betas for an instance of the 10% buffer strategies, as represented by Cboe S&P 500 Buffer Protect Index February Series (SPRO02), showed a range from 0.037 to 0.863. That is not noise—it’s fundamental to how the strategy works.
Figure 2: 1-Year Rolling Beta Against the S&P 500

Source: Bloomberg from 3/31/2016 to 3/31/2025. Beta is based on the S&P 500 TR USD Index (SPXT).
Here is an illustration of how a motivated critic can exploit this information. They can use the most recent beta of 0.65 for the representative buffer strategy to construct a synthetic benchmark portfolio of 65% S&P 500 / 35% 3-Month T-Bills. They can then use that performance as benchmark for the buffer strategy. Sure enough, when you do this analysis against the SPRO Index, the results look damning for the buffer strategy.
Figure 3: Total Return Comparison Since Common Inception:
S&P 500 10% Buffer Index vs. 65/35 S&P 500/T-Bill Portfolio (No Rebalancing)

Source: Bloomberg. Data from 3/31/2016 to 3/31/2025. The S&P 500 Total Return USD Index (SPX) represents the S&P 500; T-Bills are represented by the Bloomberg U.S. Treasury Bills: 1–3 Months Total Return Index (LD12TRUU). The "No Rebalance" scenario assumes a static allocation of 65% to the S&P 500 and 35% to T-Bills, established on 3/31/2016 and held without rebalancing through 3/31/2025.
However, as we have discussed above, such an ex-post beta analysis is biased and arbitrary. But even if one was motivated to perform such an analysis, a more appropriate benchmark should be one that periodically re-calibrates its beta to the prevailing beta of the buffer strategy - one that adjusts its equity and cash mix in line with the real-time beta so that it more accurately reflects how a new investor would evaluate an investment at a specific moment in time.
The result? The buffer strategy outperformed the more adaptive, appropriate benchmark.
Figure 4: Total Return Comparison Since Common Inception:
S&P 500 10% Buffer Index vs. 65/35 S&P 500/T-Bill Portfolio (Beta Matched)

Source: Bloomberg. Data from 3/31/2016 to 3/31/2025. The S&P 500 is represented by the S&P 500 Total Return USD Index (SPX); T-Bills are represented by the Bloomberg U.S. Treasury Bills: 1–3 Months Total Return Index (LD12TRUU). The "Beta Matched" scenario assumes that the allocation between the S&P 500 and T-Bills is determined by the quarterly beta of SPRO. For example, if SPRO’s beta in a given quarter is 0.65, then 65% of the portfolio is allocated to equities and 35% to T-Bills. As SPRO’s beta relative to the S&P 500 changes over time, the equity and fixed income weights in the Beta Matched portfolio adjust accordingly.
This points to a key insight:
If the benchmark changes when the beta changes, it becomes a better reflection of the strategy’s true behavior—and a more honest test of its value.
Comparing to the Wrong Timeframe
Critics often compare returns over timeframes that may be arbitrarily chosen based on fund launch dates or convenient analysis windows. But buffer strategies are designed around defined outcome periods—typically one year. While there are analytical tools to judge buffer strategies over different holding periods, critics often skip analyzing them over the specific defined outcome period.
To evaluate them along this dimension, we analyzed actual point-to-point 1-year returns over the buffer strategy’s target outcome period across all monthly tranches of the Cboe S&P 500 10% Buffer Index (SPRO) since the inception of the index in March 2016. Here's what we found.
Figure 5: Point-to-Point Annual Returns & Variability of Returns for Cboe S&P 500 Buffer Strategy

Figure 6: Risk/Return Comparison: S&P 500 Buffer Indices vs. S&P 500/T-Bill Allocation Mix
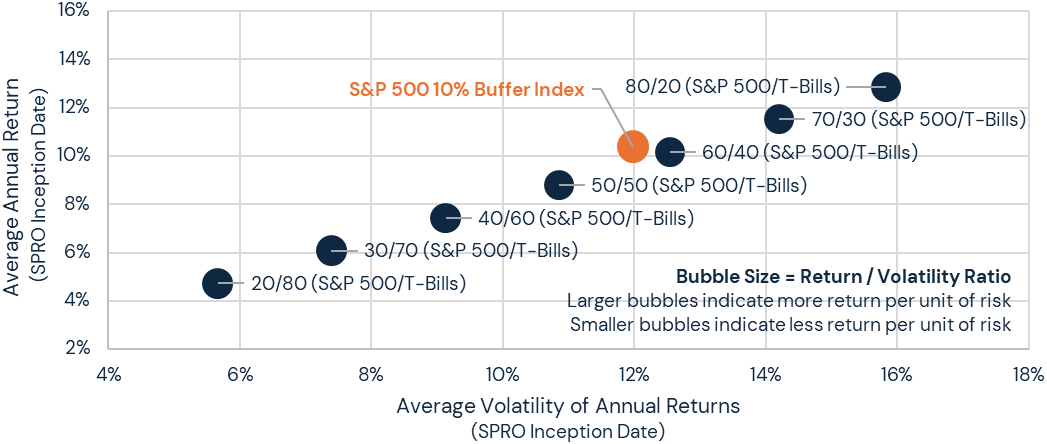
Source: Bloomberg. Data from 3/31/2016 to 3/31/2025. S&P 500/T-Bill portfolios are composed of the S&P 500 Total Return USD Index (SPXT) and the Bloomberg U.S. Treasury Bills: 1–3 Months Total Return Index (LD12TRUU).
When measured over their actual outcome periods, buffer strategies outperform linear benchmarks on a risk-adjusted basis.
Theoretical Benchmarks vs. Real-World Portfolios
The criticism often cites comparison to cash and equity portfolios. In practice though, financial advisors allocate across multi-asset portfolios that primarily comprise equities and bonds.
So, we re-ran our analysis using realistic portfolios of equity and fixed income.
Figure 7: Corresponding Annual Returns & Variability of Returns for Synthetic Equity Bond Portfolios

Figure 8: Risk/Return Comparison: S&P 500 Buffer Indices vs. S&P 500/ Bond Aggregate Allocation Mix

Source: Bloomberg. Data from 3/31/2016 to 3/31/2025. S&P 500/Bond Agg are composed of the S&P 500 Total Return USD Index (SPXT) and Bloomberg US Agg Total Return Value Unhedged USD Index (LBUSTRUU).
And here's the critical point that the data above illustrates: bond allocations introduce a different set of risks—duration risk, reinvestment risk, credit risk, and inflation risk—that do not exist in a buffer strategy.
These risks become particularly evident in rate shock environments as we saw in 2022, when bond-equity correlations broke down. Meanwhile, buffer strategies continue to do exactly what they are designed to do: offer downside protection with clarity and transparency.
In effect, advisors are choosing between:
- A blend of market beta and interest rate sensitivity, or
- A tool that structurally reshapes return outcomes without adding new sources
of macroeconomic risk.
Just as one would not compare a seatbelt to driving slower and say they offer the same safety, knowledgeable investors see the value beyond the superficial equity/cash comparison and understand the critical core tenet: that it is about how risk is managed—not just how much.
Conclusion: Let's Measure Buffer Strategies for What They Are
Benchmarking is essential, but it must match a strategy’s intent, structure, and real-world use.
Buffer strategies are not beta-replication tools. They certainly were not intended to outperform long only equities as critics might suggest. They are engineered, derivative-based solutions built to reshape risk exposure—clearly, transparently, and contractually. They are outcome-focused solutions designed to help investors define their upside, limit their downside, and stay invested through market turbulence.
Let’s move beyond simplistic comparisons and start benchmarking these tools for what they are—innovative, structured, investor-first strategies that deserve their own lens.
Disclosures
Cboe Global Markets (“CGM”) calculates and disseminates SPRO (each, the “Index”). Supporting documentation for any claims, comparisons, statistics or other technical data is available from CGM upon request. The Index and the methodology used to calculate the Index, are the property of CGM. CGM indirectly owns a minority interest in Vest. Cboe® is a registered trademark of CGM. The Index methodology involves the S&P 500 Index. S&P® is a registered trademark of Standard & Poor’s Financial Services LLC ("S&P"). The Index and Cboe trademarks have been licensed for use by Vest.
Investment vehicles such as ETFs, mutual funds or managed accounts (collectively “Funds”) may seek to follow a particular strategy or track an index, such as the Index. Funds can have significantly lower performance compared to the strategy or index that they seek to follow. CGM and/or its affiliates (“CGM Group”) do not sponsor, endorse, sell or promote Funds. S&P and/or its affiliates (together, the "S&P Group") do not sponsor, endorse, sell or promote Funds. While Funds may be listed on an exchange that is an affiliate of CGM, neither the CGM Group nor the S&P Group make any representation regarding the advisability of investing in any Funds.
Neither the Cboe Group nor the S&P Group guarantees the adequacy, accuracy, timeliness and/or completeness of the Index, S&P500® Index, or any methodology or data related thereto, and neither the CGM Group nor the S&P Group shall have any liability for any errors, omissions, or interruptions therein. CGM is not an investment advisor, and CGM makes no representation regarding the advisability of investing in any investment fund or other investment vehicle. CGM makes no assurance that investment products based on the Index will accurately track index performance or provide positive investment returns.
Options strategies involve risk and are not suitable for all investors. The protection intended by
a strategy is not guaranteed and it is possible to lose more than the targeted buffer. The opinions and forecasts expressed may not actually come to pass. This information is as of the date provided, and is subject to change at any time, based on market and other conditions. All content has been provided for informational or educational purposes only. Target Outcome Investments® and Target Buffer Strategies® are registered trademarks of Vest Financial. Investment advisory services are provided by Vest Financial LLC, a SEC registered investment adviser. This communication does not constitute an offer to sell or the solicitation of an offer to buy any security. By providing this information, Vest is not undertaking to give advice in any fiduciary capacity within the meaning of ERISA, the Internal Revenue Code, or any other regulatory framework. Financial professionals are responsible for evaluating investment risks independently and exercising independent judgment to determine whether investments are appropriate for their clients.
